
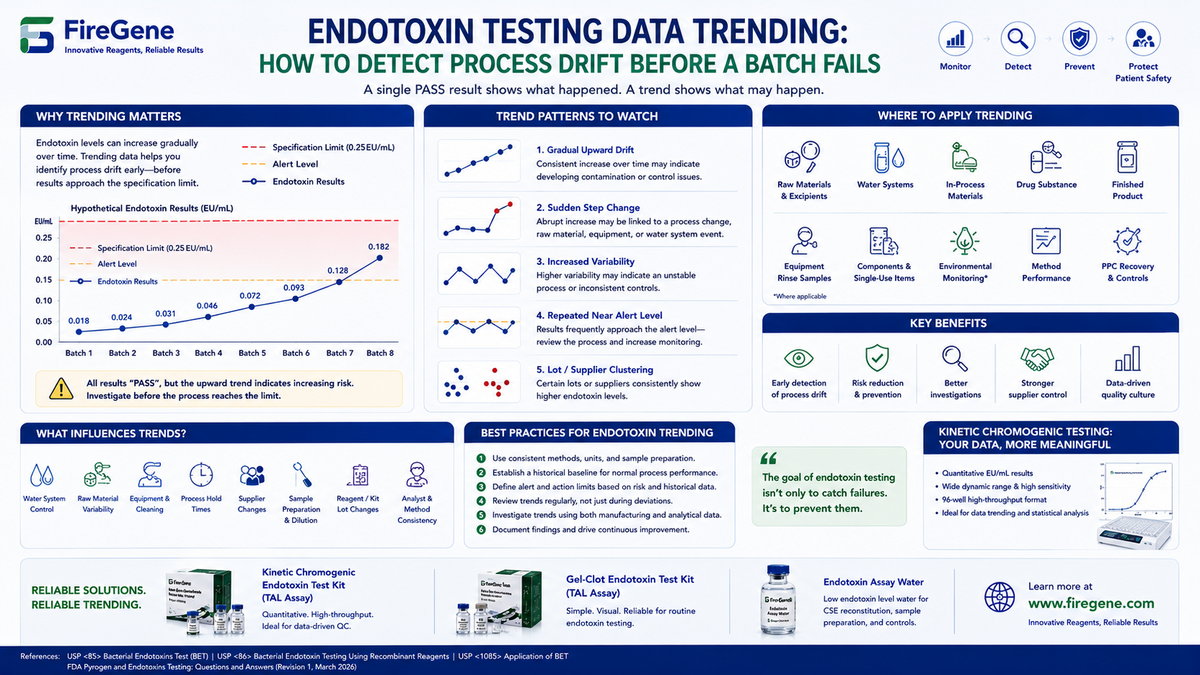
Introduction: A Passing Endotoxin Test Does Not Always Mean Everything Is Under Control
In pharmaceutical quality control, endotoxin testing is often viewed as a simple release decision:
PASS → Release
FAIL → Investigate
But this approach can overlook one of the most valuable sources of information in an endotoxin testing program:
the trend.
Consider a hypothetical series of endotoxin results:
0.018 EU/mL
→ 0.024 EU/mL
→ 0.031 EU/mL
→ 0.046 EU/mL
→ 0.072 EU/mL
Every individual result may still be below the established product specification.
If the laboratory only evaluates PASS or FAIL, all five results appear acceptable.
But the pattern tells a different story.
The endotoxin level is moving consistently upward.
That could indicate a developing problem with:
- Water-system control
- Raw materials
- Equipment cleaning
- Process hold times
- Manufacturing conditions
- Supplier variability
- Sample preparation
- Environmental contamination
- Process changes
This is why endotoxin testing data trending deserves more attention in modern pharmaceutical QC.
The goal is not to replace established specifications.
The goal is to identify potential process drift before it becomes a specification failure.
FDA's current March 2026 guidance continues to emphasize appropriate endotoxin testing of relevant components and finished products, while USP guidance recognizes the need for appropriate application of bacterial endotoxin testing to increasingly complex pharmaceutical products.
What Is Endotoxin Data Trending?
Endotoxin data trending is the systematic review of endotoxin test results over time to identify meaningful changes, patterns, or abnormal behavior.
Instead of asking only:
“Did this batch pass?”
the laboratory also asks:
“How does this result compare with previous results?”
and:
“Is the process behaving consistently?”
Trending can be applied to different types of samples, including:
- Finished products
- Drug substances
- Raw materials
- Excipients
- Process intermediates
- Pharmaceutical water
- Equipment rinse samples
- Components
- Environmental or process-monitoring samples, where applicable
The objective is not simply to collect more data.
It is to turn existing endotoxin test results into actionable quality information.
Why PASS/FAIL Testing Alone Can Miss Early Warning Signs
A specification is generally designed to define an acceptable boundary.
But a specification does not necessarily describe the normal operating behavior of a process.
For example, suppose the endotoxin specification for a hypothetical product is:
NMT 0.25 EU/mL
Now consider:
- Batch 1: 0.015 EU/mL
- Batch 2: 0.019 EU/mL
- Batch 3: 0.027 EU/mL
- Batch 4: 0.041 EU/mL
- Batch 5: 0.065 EU/mL
All five batches pass.
Yet the process is clearly behaving differently from where it started.
A trend may therefore become visible long before the formal specification limit is reached.
This is particularly valuable because endotoxin contamination can originate from multiple stages of pharmaceutical manufacturing.
FireGene's guide on Endotoxin Risk Assessment Throughout the Pharmaceutical Manufacturing Lifecycle discusses how endotoxin risk can be considered from raw materials through manufacturing and final product release.
Data trending adds another layer:
Risk Assessment → Monitoring → Trending → Early Detection → Investigation
Endotoxin Trending Is Different From Setting a Product Specification
This distinction is critical.
Product Specification
Defines the acceptance criterion for the product.
Trend Analysis
Evaluates how results behave over time.
These should not be confused.
A trend alert does not automatically mean:
“The batch fails.”
Likewise, a result below specification does not automatically mean:
“There is no quality concern.”
A statistically or scientifically meaningful trend may justify further investigation even when individual results remain within specification.
The exact alert and action strategy should be established within the laboratory's quality system and based on the specific product, process, risk assessment, and applicable requirements.
What Should Be Trended in an Endotoxin Testing Program?
A mature endotoxin monitoring program should consider more than just the final numerical result.
Useful trending variables may include:
1. Endotoxin Concentration
For example:
EU/mL
EU/mg
EU/unit
or another applicable unit.
2. Sample Location
Where was the sample collected?
For example:
- Raw material
- Process intermediate
- Water loop
- Filling line
- Finished product
3. Batch Number
Batch-to-batch comparisons can reveal gradual shifts.
4. Manufacturing Date
Time-based analysis can reveal seasonal or operational patterns.
5. Supplier or Raw Material Lot
This can help identify supplier-specific variability.
6. Sample Dilution
Changes in dilution can influence interpretation and should be tracked.
7. Test Method
For example:
- Gel-Clot
- Kinetic Chromogenic
- Kinetic Turbidimetric
- Recombinant reagent-based method
8. Analyst
Analyst-related patterns can sometimes help identify training or procedural issues.
9. Reagent Lot
Changes in reagent lots should be considered when interpreting unexpected shifts.
10. Equipment
For kinetic assays, instrument-related variables may also be relevant.
This broader dataset can help distinguish a genuine process trend from an analytical artifact.
The Most Important Endotoxin Trend Patterns to Watch
Not every change is meaningful.
However, several patterns deserve attention.
Pattern 1: Gradual Upward Drift
Example:
0.02 → 0.03 → 0.04 → 0.06 → 0.08 EU/mL
A consistent upward movement may indicate a developing process problem.
Pattern 2: Sudden Step Change
Example:
0.02 → 0.03 → 0.02 → 0.04 → 0.18 EU/mL
A sudden jump may indicate:
- Process change
- Raw material change
- Equipment intervention
- Water-system event
- Cleaning deviation
- Analytical issue
Pattern 3: Increased Variability
Example:
0.03 → 0.09 → 0.02 → 0.11 → 0.04 EU/mL
The average may remain acceptable while variability increases.
That can still be useful information.
Pattern 4: Repeated Results Near an Internal Threshold
If results repeatedly approach an internally established alert level, the process may warrant investigation even before a formal specification failure occurs.
Pattern 5: Lot-Specific Clustering
Suppose multiple batches using the same raw-material supplier consistently produce higher endotoxin results.
That may justify reviewing:
- Supplier history
- Raw-material testing
- Storage conditions
- Transportation
- Incoming lot variability
FireGene's article on Endotoxin Testing for Raw Materials and Excipients provides a related framework for controlling endotoxin risk before manufacturing begins.
Why Water System Data Should Be Trended
Pharmaceutical water is one of the most important areas for endotoxin monitoring.
A single water sample may pass.
But a trend can reveal:
0.003 EU/mL
→ 0.005 EU/mL
→ 0.008 EU/mL
→ 0.012 EU/mL
→ 0.019 EU/mL
Even if individual results remain acceptable, the upward trajectory may suggest a change in system performance.
Possible factors may include:
- Biofilm development
- Sanitization effectiveness
- Loop stagnation
- Maintenance activities
- Sampling changes
- Microbial proliferation
- Distribution-system issues
FDA inspection guidance has long emphasized the importance of controlling water systems and considering endotoxin risk associated with microbial contamination.
FireGene's Why Water System Monitoring Is the Foundation of Reliable Endotoxin Testing provides a deeper discussion of water-system endotoxin control.
For laboratory testing itself, endotoxin-free water is equally important. FireGene's Endotoxin Assay Water is intended for CSE reconstitution, standard dilution, sample preparation, and negative controls.
Trending Raw Material Endotoxin Results
Raw materials can introduce endotoxin into downstream manufacturing.
A supplier may consistently provide material within specification.
But suppose the historical results look like:
0.04 EU/g
0.05 EU/g
0.06 EU/g
0.08 EU/g
0.11 EU/g
Each lot may pass.
However, the trend suggests increasing endotoxin burden.
This could become important if the raw material is used in a process where endotoxin removal is difficult.
Trending can therefore support supplier-management activities such as:
- Supplier qualification
- Supplier monitoring
- Incoming QC
- Supplier performance review
- Material risk assessment
The goal is not necessarily to reject material simply because the trend increased.
Instead, the trend can trigger a risk-based review.
Finished Product Trending: What Does an Increase Mean?
A rising finished-product endotoxin trend does not automatically mean the product itself is becoming contaminated.
The source could be upstream.
Potential contributors include:
- Raw materials
- Process water
- Equipment
- Single-use components
- Process hold times
- Cleaning
- Manufacturing environment
- Sampling
- Analytical variation
This is why endotoxin trending should be connected to manufacturing data.
For example:
Endotoxin increase
New raw-material supplier
New cleaning procedure
Water-system maintenance
could provide a much stronger investigative direction than the endotoxin result alone.
How Kinetic Chromogenic Testing Supports Data Trending
Quantitative endotoxin methods can provide particularly useful datasets for trending because they generate numerical results rather than simply a binary endpoint.
Kinetic Chromogenic endotoxin testing can provide:
- Quantitative EU/mL results
- Standard curves
- Replicate measurements
- Numerical datasets
- High-throughput results
- Automated data acquisition
FireGene's Kinetic Chromogenic Endotoxin Test Kit is designed for quantitative endotoxin testing using a 96-well format and 405 nm absorbance measurement.
For laboratories building quantitative endotoxin datasets, FireGene's Kinetic Chromogenic Endotoxin Testing in 2026 provides additional discussion of automated and data-driven QC workflows.
However, quantitative output alone does not guarantee useful trending.
The underlying assay must remain valid.
Why Method Suitability Comes Before Trend Analysis
Imagine a laboratory sees this pattern:
0.05 → 0.07 → 0.09 → 0.12 EU/mL
Before concluding that the manufacturing process is drifting, analysts should confirm that the analytical method remains suitable.
Questions include:
- Was the same method used?
- Was the reagent lot changed?
- Was sample dilution changed?
- Was the product formulation changed?
- Were PPC results acceptable?
- Was the standard curve valid?
- Were controls within acceptance criteria?
- Was the instrument performing normally?
A trend built from invalid or non-comparable data can produce the wrong conclusion.
This is why method suitability is foundational.
FireGene's How to Validate an Endotoxin Test Method discusses product-specific method suitability, PPC recovery, dilution, and matrix interference.
Sample Preparation Can Create False Trends
Not every change in endotoxin results comes from the product.
Sample preparation can also influence results.
Important variables include:
- Dilution factor
- Mixing
- pH
- Sample storage
- Holding time
- Container compatibility
- Pipetting
- Temperature
- Matrix interference
For example, if a laboratory changes the sample dilution from:
1:10
to:
1:50
without appropriate evaluation, the resulting dataset may not be directly comparable with historical results.
Similarly, a new sample preparation procedure may change recovery.
FireGene's Endotoxin Testing Sample Preparation Guide discusses how dilution, matrix effects, PPC recovery, and sample preparation can influence endotoxin test results.
Therefore:
Trend analysis requires comparable analytical conditions.
Reagent Lot Changes Should Also Be Considered
TAL/LAL Reagent performance is controlled through quality requirements, but reagent lot changes can still be relevant when investigating shifts in laboratory data.
When an unexpected trend appears, review:
- Reagent lot
- CSE lot
- Water lot
- Consumable lot
- Instrument
- Analyst
- SOP revision
A change coinciding with a reagent lot transition does not automatically prove that the reagent caused the trend.
It simply provides another variable to investigate.
This is particularly important for kinetic chromogenic assays because multiple analytical parameters contribute to the final quantitative result.
How to Distinguish Process Drift From Analytical Drift
This is one of the most important questions in endotoxin data trending.
Suppose endotoxin results suddenly increase.
There are two broad possibilities:
Process Drift
The product or manufacturing process has changed.
Analytical Drift
The testing system has changed.
A structured investigation can compare:
Product data
with:
Control data
For example:
- Standard curve performance
- Negative control
- PPC recovery
- Replicate precision
- Reagent lot
- Instrument performance
If controls remain stable while product results increase, process-related explanations become more important.
If both product results and analytical controls change, the laboratory should investigate the test system itself.
How Positive Product Controls Support Trend Interpretation
Positive Product Controls are useful not only during initial method suitability work.
They can also provide important context for unexpected results.
Suppose a product suddenly shows:
0.15 EU/mL
while historical results were:
0.03–0.06 EU/mL
If the PPC remains within the applicable recovery criteria and the standard curve is valid, the product result deserves closer process investigation.
If PPC recovery fails, however, the laboratory may need to investigate matrix interference or analytical suitability before concluding that the product endotoxin level truly increased.
This distinction can prevent unnecessary manufacturing investigations based on an analytical artifact.
Should Laboratories Use Alert Limits and Action Limits?
Many quality systems use internal alert and action concepts to support process monitoring.
The exact approach should be scientifically justified and integrated into the organization's quality system.
A conceptual framework could be:
Normal Range
Results remain consistent with historical process behavior.
Alert Level
A result or trend indicates that additional review may be appropriate.
Action Level
The defined threshold triggers a formal investigation or predefined action.
These internal levels should not automatically replace the official product specification.
Instead:
Specification = product acceptance
Alert/Action framework = process monitoring
That distinction is extremely important.
Statistical Approaches to Endotoxin Trend Analysis
Simple graphs can already reveal a surprising amount of information.
However, more mature QC programs may use statistical tools to evaluate trends.
Potential approaches include:
Moving Averages
Useful for smoothing short-term variation.
Control Charts
Can help identify unusual shifts or trends in a stable process.
Regression Analysis
Can help quantify whether results are increasing or decreasing over time.
Standard Deviation
Provides information about process variability.
Percentiles
Can help characterize historical data distributions.
Stratification
Data can be separated by:
- Product
- Site
- Supplier
- Water loop
- Manufacturing line
- Sample type
The most important principle is not to apply sophisticated statistics simply because they are available.
The statistical approach should match:
- Data volume
- Data distribution
- Process characteristics
- Risk
- Intended decision
Example: Detecting a Hidden Endotoxin Trend
Imagine a pharmaceutical manufacturing process with a finished-product endotoxin specification of:
NMT 0.25 EU/mL
Historical results:
| Batch | Endotoxin Result |
|---|---|
| 01 | 0.021 EU/mL |
| 02 | 0.025 EU/mL |
| 03 | 0.028 EU/mL |
| 04 | 0.035 EU/mL |
| 05 | 0.041 EU/mL |
| 06 | 0.052 EU/mL |
| 07 | 0.061 EU/mL |
| 08 | 0.078 EU/mL |
Every batch passes.
But the trend is clear.
The result has increased almost fourfold.
A responsible QC team should ask:
What changed?
Potential investigation areas include:
- Raw-material lots
- Water-system performance
- Equipment cleaning
- Manufacturing hold times
- Process temperature
- Supplier changes
- Single-use components
- Sampling procedures
- Endotoxin reagent lot
- Analytical method changes
This is the real value of trending.
The laboratory has potentially identified a problem before the product reaches the specification limit.
Endotoxin Trending During Process Changes
Process changes are particularly important.
Examples include:
- New raw-material supplier
- New manufacturing equipment
- New cleaning process
- New water-system configuration
- New formulation
- New container
- New single-use assembly
- New manufacturing site
- Revised sample preparation
- New endotoxin testing method
When a significant process change occurs, historical endotoxin data can provide a baseline.
The laboratory can then compare:
Before Change
vs.
After Change
This helps determine whether the change is associated with:
- Increased endotoxin levels
- Reduced endotoxin levels
- Increased variability
- No meaningful change
FireGene's sample-preparation guidance also notes that method suitability may need reassessment after significant changes to product or analytical conditions.
What About New Endotoxin Testing Technologies?
Endotoxin testing itself is evolving.
Traditional LAL/TAL-based approaches remain important, while USP <86> introduces additional bacterial endotoxin testing techniques using recombinant reagents. FDA's March 2026 revised guidance also broadened its language around recombinant reagents and emphasizes that sponsors should verify that the selected method is suitable for its intended purpose.
This creates an important consideration for trending:
Historical data generated using different analytical methods may not always be directly comparable.
If a laboratory transitions from one methodology to another, it should establish an appropriate comparability strategy before combining datasets for long-term trend interpretation.
For example:
Method A
↓
Historical baseline
Method B
↓
New analytical baseline
Rather than simply combining every result into one graph without considering the method change.
Endotoxin Trending for mRNA-LNP and Other Complex Products
The need for careful trend interpretation becomes even more important for complex pharmaceutical products.
Examples include:
- mRNA-LNP therapeutics
- Monoclonal antibodies
- Cell therapy products
- Gene therapy products
- Protein therapeutics
- Complex injectable formulations
These products can contain components that influence endotoxin assay performance.
For example, LNP formulations may contain:
- Ionizable lipids
- Phospholipids
- Cholesterol
- PEG-lipids
- mRNA
- Buffers
- Salts
- Stabilizers
If the matrix changes, the analytical response may change.
Therefore, an apparent endotoxin trend should always be interpreted alongside method suitability and PPC recovery.
FireGene's Endotoxin Testing for mRNA-LNP Therapeutics: Why Matrix Suitability Matters provides a related discussion of matrix interference, dilution, MVD, and PPC recovery.
A Practical Endotoxin Data Trending Workflow
A pharmaceutical QC laboratory can build a practical workflow around eight steps.
Step 1: Define the Data Population
Determine which samples should be included.
For example:
Finished Product
or:
Water System
or:
Raw Material
Step 2: Standardize Units
Avoid mixing:
EU/mL
with:
EU/mg
without appropriate normalization.
Step 3: Confirm Method Comparability
Document:
- Assay method
- Reagent
- Instrument
- Sample preparation
- Dilution
- Applicable method version
Step 4: Establish a Historical Baseline
Use sufficient historical data to characterize normal process behavior.
Step 5: Visualize the Data
Simple charts can reveal:
- Upward trends
- Downward trends
- Outliers
- Clusters
- Sudden shifts
Step 6: Define Internal Alert and Action Criteria
Use a scientifically justified quality-system approach.
Step 7: Investigate Significant Changes
Review:
- Manufacturing
- Water
- Raw materials
- Equipment
- Cleaning
- Suppliers
- Analytical variables
Step 8: Close the Feedback Loop
Use the findings to improve:
- Process controls
- Sampling plans
- Supplier management
- Water monitoring
- Analytical procedures
- Training
This turns endotoxin testing from a passive release test into an active process-monitoring tool.
Common Mistakes in Endotoxin Trend Analysis
Mistake 1: Looking Only at PASS/FAIL
This can hide gradual process drift.
Mistake 2: Combining Non-Comparable Data
Results generated using different methods or substantially different sample preparation conditions may not be directly comparable.
Mistake 3: Ignoring Analytical Variables
A trend may originate from the test system rather than the manufacturing process.
Mistake 4: Overreacting to One Outlier
A single result does not necessarily establish a trend.
Mistake 5: Ignoring Small Increases
Repeated small increases can be more informative than one isolated high result.
Mistake 6: Using Alert Limits as Product Specifications
Internal monitoring limits and formal product specifications serve different purposes.
Mistake 7: Ignoring Raw Materials
Finished-product trends may originate upstream.
Mistake 8: Ignoring Water Systems
Water can be a critical source of microbial and endotoxin risk.
Mistake 9: Failing to Document Method Changes
Analytical changes can create apparent trends that are not actually process-related.
Mistake 10: Treating Trending as a Spreadsheet Exercise
The real purpose is not visualization.
It is early detection and preventive action.
How Endotoxin Trending Supports Pharmaceutical Quality by Design
A modern quality system should ideally detect problems before they become failures.
The progression is:
Traditional QC
Test → Pass/Fail → Release
versus:
Data-Driven QC
Test → Trend → Detect Drift → Investigate → Prevent → Improve
This philosophy aligns naturally with a broader risk-based approach to pharmaceutical quality.
Endotoxin testing becomes one data stream within a larger process-monitoring system.
The laboratory can combine:
Endotoxin Data
Bioburden Data
Water Data
Raw Material Data
Manufacturing Data
Cleaning Data
to build a much stronger understanding of process performance.
Frequently Asked Questions
What is endotoxin data trending?
Endotoxin data trending is the systematic evaluation of endotoxin test results over time to identify patterns, shifts, variability, and potential process drift.
Why is endotoxin trending important?
Because a process can gradually deteriorate while individual results remain below the formal product specification.
Does an upward trend mean the batch fails?
No. A trend does not automatically mean that a batch fails its established specification. It may instead trigger additional review or investigation according to the applicable quality system.
What endotoxin results should be trended?
Potential datasets include finished products, drug substances, raw materials, excipients, pharmaceutical water, process samples, and other appropriately monitored materials.
Can endotoxin results from different methods be trended together?
Not automatically. Differences in analytical methodology, sample preparation, reagent systems, and other conditions may affect comparability.
Should reagent lot changes be considered?
Yes. Reagent lot changes can be one of several variables reviewed when investigating a shift in analytical results.
Can kinetic chromogenic testing help with endotoxin trending?
Yes. Quantitative endotoxin results can provide useful numerical datasets for trend analysis when the analytical method is suitably controlled and validated.
Can endotoxin trending detect water-system problems?
Potentially. Long-term water endotoxin data may reveal gradual changes that are not obvious from individual pass/fail results.
What is the difference between an alert limit and a specification?
A product specification defines an acceptance criterion, while an internal alert limit may be used to identify unusual process behavior before a specification failure occurs.
How often should endotoxin data be reviewed?
The appropriate frequency depends on the product, process, risk level, testing volume, and quality-system requirements. High-risk or high-frequency datasets may benefit from more frequent review.
Conclusion: The Most Valuable Endotoxin Result May Be the Trend
A single endotoxin result tells you what happened to one sample.
A trend can tell you what may be happening to the process.
That difference is becoming increasingly important as pharmaceutical manufacturing moves toward more data-driven quality control.
The most effective endotoxin testing programs should therefore look beyond:
PASS
or:
FAIL
and ask:
Is the process stable?
Are results drifting?
Has variability changed?
Did something change upstream?
Is the analytical method still performing consistently?
Can we identify the risk before a specification failure occurs?
A strong endotoxin trending strategy can connect laboratory data with manufacturing intelligence:
Raw Materials
↓
Water Systems
↓
Manufacturing Process
↓
Endotoxin Testing
↓
Data Trending
↓
Early Warning
↓
Investigation
↓
Preventive Action
This is the next step in moving endotoxin testing from a purely reactive QC activity toward a more proactive, risk-based, and data-driven pharmaceutical quality strategy.
And as endotoxin testing technologies continue to evolve—including traditional Gel-Clot and photometric methods alongside recombinant-reagent approaches recognized in the current regulatory landscape—the ability to generate, validate, compare, and intelligently interpret endotoxin data will become increasingly important. FDA's 2026 guidance specifically emphasizes method suitability when using endotoxin testing approaches, while USP <1085> highlights the need for appropriate application of bacterial endotoxin testing to increasingly complex pharmaceutical formulations.
The goal of endotoxin testing is not simply to catch failures.
The goal is to prevent them.
FireGene Endotoxin Testing
Ready to run your endotoxin assay?
FireGene offers a complete endotoxin testing toolkit — from TAL reagents and CSE standards to pyrogen-free consumables and LAL reagent water. All products are aligned with USP <85>, EP 2.6.14, and JP 4.01.


