1. Purpose
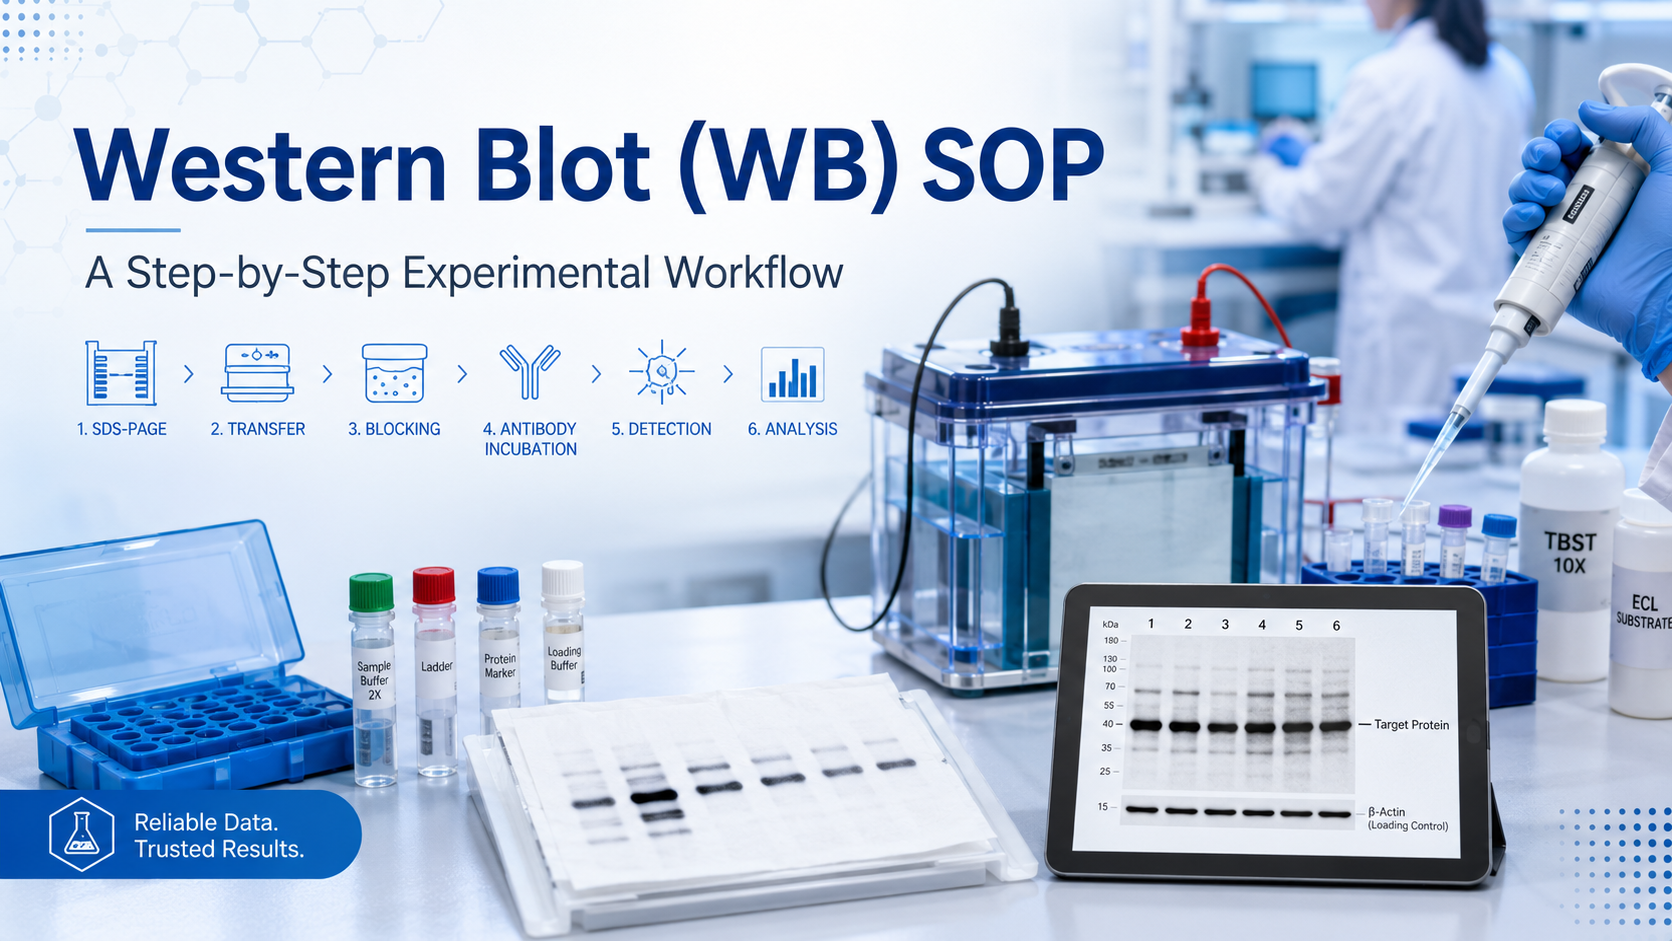
This Standard Operating Procedure (SOP) describes the complete experimental process for Western Blot (WB), also known as immunoblotting. Western Blot is a widely used molecular biology technique for detecting, identifying, and semi-quantifying specific proteins in cell lysates, tissue extracts, or other biological samples. This SOP provides a clear workflow covering protein extraction, protein quantification, SDS-PAGE electrophoresis, membrane transfer, blocking, antibody incubation, signal detection, and data analysis.
Western Blot analysis is commonly used in biomedical research, cancer biology, immunology, neuroscience, metabolic disease research, and drug discovery. A standardized WB protocol helps improve reproducibility, reduce background noise, and ensure reliable protein expression analysis.
2. Principle
The Western Blot technique separates proteins according to molecular weight by sodium dodecyl sulfate-polyacrylamide gel electrophoresis, or SDS-PAGE. After separation, proteins are transferred from the gel onto a PVDF or nitrocellulose membrane. The membrane is then incubated with a specific primary antibody that recognizes the target protein. A labeled secondary antibody binds to the primary antibody and enables signal detection, usually by chemiluminescence, fluorescence, or colorimetric methods.
The intensity of the detected protein band can be analyzed using image analysis software. Target protein expression is usually normalized to a housekeeping protein, such as GAPDH, β-actin, or tubulin.
3. Materials and Reagents
Required materials include cell or tissue samples, PBS, RIPA lysis buffer or another suitable protein extraction buffer, protease inhibitor cocktail, phosphatase inhibitors if phosphorylated proteins are analyzed, BCA or Bradford protein assay kit, SDS-PAGE gel, electrophoresis buffer, transfer buffer, PVDF or nitrocellulose membrane, methanol for PVDF membrane activation, TBST buffer, blocking reagent, primary antibody, HRP-conjugated or fluorescence-labeled secondary antibody, ECL chemiluminescent substrate, protein loading buffer, protein marker, and imaging equipment.
Common blocking reagents include 5% non-fat dry milk and 5% bovine serum albumin. For phosphorylated proteins, BSA is generally preferred because milk contains casein, which may interfere with phospho-specific antibody detection.
4. Equipment
The experiment requires a refrigerated centrifuge, vortex mixer, pipettes, microcentrifuge tubes, heating block or boiling water bath, electrophoresis system, transfer apparatus, shaker or rocker, gel imaging or chemiluminescence imaging system, and image analysis software such as ImageJ.
All instruments should be clean and calibrated when necessary. Reagents should be prepared using high-quality water and stored according to manufacturer recommendations.
5. Sample Preparation and Protein Extraction
For cultured cells, remove the culture medium and wash cells gently with cold PBS to remove serum proteins and residual medium. Add an appropriate volume of ice-cold lysis buffer containing protease inhibitors. If phosphorylation status is being investigated, add phosphatase inhibitors immediately before use.
Scrape adherent cells from the culture dish and transfer the lysate into a pre-chilled microcentrifuge tube. Incubate the lysate on ice for 20–30 minutes with occasional mixing. For tissue samples, cut the tissue into small pieces, add lysis buffer, and homogenize thoroughly on ice.
After lysis, centrifuge the samples at 12,000–14,000 × g for 10–15 minutes at 4°C. Carefully collect the supernatant without disturbing the pellet. The supernatant contains extracted total protein and should be kept on ice for immediate use or stored at −80°C for later analysis.
Avoid repeated freeze-thaw cycles because they may cause protein degradation and affect Western Blot results.
6. Protein Quantification
Determine protein concentration using a BCA assay, Bradford assay, or another validated method. Prepare protein standards according to the assay instructions. Dilute the samples when necessary to ensure that the readings fall within the linear range of the standard curve.
Accurate protein quantification is important because equal protein loading is essential for reliable comparison between samples. After concentration measurement, adjust all samples to the same protein concentration using lysis buffer.
7. Sample Denaturation
Mix each protein sample with SDS loading buffer. A common ratio is four parts protein sample to one part 5× loading buffer. Heat the samples at 95–100°C for 5–10 minutes to denature the proteins and allow SDS to bind uniformly.
After heating, briefly centrifuge the tubes to collect condensation and remove bubbles. Samples can be loaded immediately or stored at −20°C for short-term use.
For some membrane proteins or large protein complexes, excessive boiling may cause aggregation. In such cases, heating at 70°C for 10 minutes may be more suitable.
8. SDS-PAGE Electrophoresis
Select the appropriate gel percentage according to the molecular weight of the target protein. Lower percentage gels are suitable for large proteins, while higher percentage gels are better for small proteins. For example, 6–8% gels are commonly used for proteins above 100 kDa, 8–10% gels for 50–100 kDa proteins, 10–12% gels for 20–50 kDa proteins, and 12–15% gels for proteins below 20 kDa.
Assemble the electrophoresis apparatus and fill the chamber with running buffer. Load equal amounts of protein into each well, typically 20–40 μg per lane, depending on sample type and antibody sensitivity. Load a molecular weight marker in one lane.
Run the gel at low voltage, such as 70–80 V, until proteins pass through the stacking gel. Then increase the voltage to 100–120 V for separation in the resolving gel. Stop electrophoresis when the dye front approaches the bottom of the gel.
9. Protein Transfer
After electrophoresis, transfer proteins from the gel to a membrane. PVDF membranes should be activated in methanol for 30–60 seconds before equilibration in transfer buffer. Nitrocellulose membranes do not require methanol activation but should be pre-wetted according to the manufacturer’s instructions.
Assemble the transfer sandwich carefully to avoid bubbles between the gel and membrane. Air bubbles can prevent protein transfer and cause blank areas on the final blot.
Wet transfer is commonly performed at 100 V for 60–120 minutes at 4°C. For large proteins, longer transfer times or lower voltage overnight transfer may improve efficiency. For small proteins, excessive transfer time should be avoided because proteins may pass through the membrane.
After transfer, confirm protein transfer using Ponceau S staining. This step allows visual inspection of total protein transfer and lane consistency.
10. Membrane Blocking
Blocking reduces nonspecific antibody binding and improves signal-to-noise ratio. Incubate the membrane in blocking buffer for 1 hour at room temperature with gentle shaking.
Use 5% non-fat dry milk in TBST for many total protein targets. Use 5% BSA in TBST for phosphorylated proteins or when milk causes high background. The choice of blocking reagent should be optimized based on the antibody and target protein.
After blocking, briefly rinse the membrane with TBST before primary antibody incubation.
11. Primary Antibody Incubation
Dilute the primary antibody in the recommended antibody dilution buffer. Typical dilution ratios range from 1:500 to 1:2000, but the optimal concentration should be determined according to the antibody datasheet and experimental conditions.
Incubate the membrane with primary antibody overnight at 4°C with gentle shaking. Overnight incubation usually improves binding specificity and sensitivity. For highly abundant proteins, incubation for 1–2 hours at room temperature may be sufficient.
After incubation, wash the membrane with TBST three times, 5–10 minutes each. Proper washing is essential to remove unbound antibody and reduce background.
12. Secondary Antibody Incubation
Dilute the appropriate secondary antibody according to the host species of the primary antibody. For example, use anti-rabbit secondary antibody for rabbit primary antibodies and anti-mouse secondary antibody for mouse primary antibodies.
Incubate the membrane with secondary antibody for 1 hour at room temperature with gentle shaking. Common dilution ratios range from 1:3000 to 1:10000 for HRP-conjugated secondary antibodies.
After secondary antibody incubation, wash the membrane with TBST three to five times, 5–10 minutes each. Additional washing may be required if background is high.
13. Signal Detection
For chemiluminescent detection, prepare the ECL substrate immediately before use. Remove excess wash buffer from the membrane and apply enough ECL reagent to cover the protein side of the membrane. Incubate for 1–3 minutes according to the substrate instructions.
Capture the signal using a chemiluminescence imaging system. Use multiple exposure times to avoid saturated bands. Overexposed bands cannot be accurately quantified and should not be used for densitometric analysis.
For fluorescence-based Western Blot detection, scan the membrane using the appropriate excitation and emission settings.
14. Data Analysis
Analyze band intensity using ImageJ or similar software. Measure the gray value of the target protein band and normalize it to the internal loading control. Common loading controls include GAPDH, β-actin, and tubulin. For nuclear proteins, Lamin B1 or Histone H3 may be used. For mitochondrial proteins, COX IV or VDAC may be appropriate.
The relative expression level can be calculated as:
Target protein relative expression = target protein band intensity / loading control band intensity
For comparative studies, normalize the experimental group to the control group. Perform at least three independent experiments when statistical analysis is required.
15. Troubleshooting
Weak or absent bands may result from low protein loading, poor transfer efficiency, inactive antibody, excessive washing, or insufficient exposure. High background may be caused by inadequate blocking, excessive antibody concentration, insufficient washing, or contaminated buffers. Nonspecific bands may occur when the antibody concentration is too high or when the antibody has low specificity.
Uneven bands may indicate poor gel polymerization, air bubbles during transfer, uneven sample loading, or incomplete membrane contact. Always include a protein marker, loading control, and appropriate positive or negative controls when possible.

16. Key Notes
Keep samples cold during protein extraction to prevent degradation. Use fresh inhibitors in lysis buffer. Maintain equal protein loading across all lanes. Select the correct gel percentage based on target protein size. Avoid membrane drying during antibody incubation. Optimize antibody dilution and incubation conditions for each target protein.
This Western Blot SOP provides a practical and reproducible workflow for protein expression analysis. By following standardized steps and optimizing key parameters, researchers can obtain reliable WB results for molecular biology, biomedical research, and drug discovery applications.
FireGene, light your research with passion, innovation, and profession.


