
Introduction
For decades, bacterial endotoxin testing has primarily been viewed as a pass-or-fail quality control test.
A sample is tested.
The endotoxin result is compared with the specification.
If the result passes, the batch moves forward.
If the result exceeds the specification, an OOS investigation begins.
But modern pharmaceutical manufacturing is becoming increasingly data-driven.
Instead of asking only:
“Did this batch pass the endotoxin test?”
quality control laboratories are increasingly asking:
“What is the endotoxin data telling us about the manufacturing process?”
This is an important distinction.
A product can remain comfortably below its endotoxin specification while the underlying trend is moving in the wrong direction.
For example:
0.015 EU/mL → 0.021 → 0.028 → 0.037 → 0.052 EU/mL
Every individual result might still be below the established limit.
But the trend may indicate that something has changed.
Possible explanations could include:
- A change in raw material quality
- Increasing bioburden upstream
- Water system deterioration
- Cleaning problems
- Manufacturing equipment contamination
- Supplier variability
- Changes in sampling practices
- Changes in product formulation
- Analytical drift
- Laboratory contamination
The result may not yet be an OOS event.
But it could be an early warning signal.
This is where endotoxin testing trend analysis becomes valuable.
USP <1085> provides expanded guidance around routine testing, sampling, PPC criteria, interference, calculation of endotoxin content, and OOS investigations, reflecting the growing importance of understanding endotoxin data beyond a single batch-release result.
At the same time, FDA's March 2026 revised guidance continues to emphasize appropriate endotoxin testing methodologies and acceptance criteria for pharmaceutical, biological, and device products.
The future of endotoxin QC is therefore not simply:
Test → Pass → Release
It is increasingly:
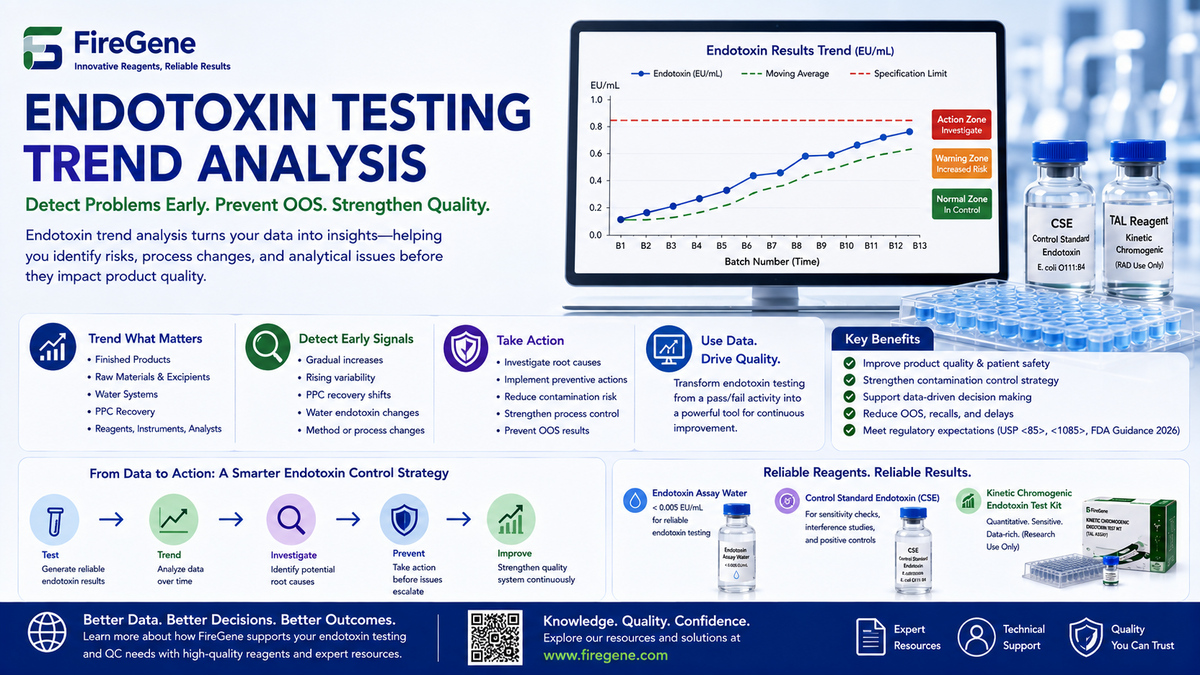
Test → Trend → Investigate → Prevent → Improve
1. What Is Endotoxin Testing Trend Analysis?
Endotoxin trend analysis is the systematic evaluation of endotoxin test results over time.
Instead of looking at one result in isolation, the laboratory evaluates patterns across:
- Lots
- Batches
- Raw materials
- Manufacturing campaigns
- Products
- Sampling locations
- Water systems
- Manufacturing equipment
- Analysts
- Instruments
- Reagent lots
- Test methods
The objective is to identify meaningful changes before they become major quality problems.
A simple example:
Batch 1
0.018 EU/mL
Batch 2
0.021 EU/mL
Batch 3
0.024 EU/mL
Batch 4
0.029 EU/mL
Batch 5
0.036 EU/mL
Batch 6
0.047 EU/mL
Every result may still comply with the specification.
However, the sequence suggests a persistent upward trend.
That trend deserves investigation.
2. Why Pass/Fail Testing Alone Is Not Enough
A specification defines a boundary.
It does not necessarily describe normal process behavior.
Imagine a product with an endotoxin specification of:
≤ 5 EU/mL
A result of:
0.05 EU/mL
would clearly pass.
But suppose the historical results were normally:
0.01–0.03 EU/mL
and the latest three results are:
0.05 → 0.08 → 0.12 EU/mL
The product is still passing.
But the process may no longer be behaving normally.
This creates two different concepts:
OOS
The result is outside the established specification.
OOT
The result may be within specification but outside the expected historical or statistical behavior.
OOS means:
The specification has been exceeded.
OOT can mean:
The process may be changing even though the specification has not yet been exceeded.
For endotoxin control, OOT detection can be particularly valuable because contamination sources can develop gradually.
3. Why Endotoxin Trends Can Reveal Hidden Manufacturing Problems
Endotoxin contamination does not necessarily appear suddenly.
In many cases, the risk can develop gradually.
For example:
Water system
↓
Increasing microbial activity
↓
Biofilm development
↓
Increasing endotoxin burden
↓
Higher process-water endotoxin
↓
Higher product endotoxin
↓
Potential OOS
If the laboratory only investigates the final OOS result, it may miss the earlier warning signals.
Trend analysis can potentially identify the problem at the:
Increasing process-water endotoxin
stage.
This creates an opportunity for preventive action.
FireGene's previous article, Why Water System Monitoring Is the Foundation of Reliable Endotoxin Testing, discusses how water-system control can influence the reliability of pharmaceutical endotoxin testing.
The key concept is:
The final product result is often the end of a contamination pathway—not the beginning.
4. What Should Be Trended?
A strong endotoxin trending program should not necessarily track only finished-product endotoxin results.
Depending on the manufacturing process, laboratories may consider trending:
Finished Product
- EU/mL
- EU/vial
- EU/dose
- Batch number
- Product concentration
Raw Materials
- Supplier
- Lot number
- Endotoxin concentration
- Material type
Water
- Sampling point
- Water loop location
- Date
- Endotoxin concentration
- Microbial results
Manufacturing Environment
- Equipment
- Process-contact surfaces
- Cleaning cycles
- Sanitization events
Analytical Testing
- Reagent lot
- Analyst
- Instrument
- PPC recovery
- Standard-curve performance
- Negative control
- Replicate variability
This creates a much more powerful dataset.
5. Finished-Product Endotoxin Trends
The simplest form of trend analysis is finished-product testing.
Suppose a pharmaceutical manufacturer records:
Batch A: 0.11 EU/mL
Batch B: 0.13 EU/mL
Batch C: 0.14 EU/mL
Batch D: 0.18 EU/mL
Batch E: 0.21 EU/mL
Batch F: 0.29 EU/mL
A basic specification check may show that all six batches pass.
But a trend chart would immediately raise a question:
Why is endotoxin concentration increasing over successive batches?
Potential investigation areas could include:
- Raw material changes
- Water-system changes
- Equipment cleaning
- Manufacturing hold time
- Environmental conditions
- Supplier changes
- Process modifications
- Sampling differences
The value of trending is that it encourages investigation before the result becomes OOS.
6. Raw Material Endotoxin Trends Can Be Even More Informative
Endotoxin control should not begin with the finished product.
Raw materials and excipients can represent an important upstream risk.
Consider a supplier whose endotoxin results gradually increase:
0.02 EU/g
↓
0.03 EU/g
↓
0.04 EU/g
↓
0.06 EU/g
↓
0.09 EU/g
↓
0.13 EU/g
The material may remain within specification.
But the trend suggests increasing variability.
Potential causes could include:
- Changes in supplier manufacturing
- Water quality
- Raw-material storage
- Microbial contamination
- Changes in purification
- Different production sites
FireGene's article Endotoxin Testing for Raw Materials and Excipients: How to Control Endotoxin Risk Before Manufacturing explores this upstream approach in more detail.
The important principle is:
Controlling endotoxin before manufacturing is often easier than trying to remove it after it enters the process.
7. Water-System Trends Are a Critical Early Warning System
Pharmaceutical water systems are particularly suitable for endotoxin trending.
A single water sample may not tell the whole story.
A sequence of results can.
For example:
Sampling Point A
January: 0.001 EU/mL
February: 0.002 EU/mL
March: 0.003 EU/mL
April: 0.006 EU/mL
May: 0.011 EU/mL
Even if the results remain within the applicable limit, the increasing pattern may justify additional investigation.
Potential areas include:
- Distribution loop
- Storage tank
- Sanitization
- Dead legs
- Sampling procedure
- Temperature
- Recirculation
- Biofilm development
This is why water-system monitoring and endotoxin trend analysis should be connected rather than treated as separate QC activities.
8. Trend PPC Recovery—Not Just Endotoxin Concentration
One of the most overlooked opportunities in endotoxin data analysis is Positive Product Control recovery.
PPC recovery provides information about whether the product matrix allows endotoxin to be detected appropriately.
Suppose historical PPC recovery is:
92%
95%
98%
94%
96%
Then suddenly:
72%
The final endotoxin result may still look acceptable.
But the analytical system is telling you that something has changed.
Possible causes include:
- Matrix changes
- Dilution problems
- Reagent changes
- Sample preparation variability
- Product concentration changes
- Analyst technique
- Instrument performance
FireGene's Control Standard Endotoxin (CSE) is designed to support endotoxin sensitivity checks, interference studies, and positive-control applications in endotoxin testing workflows.
A strong trending strategy therefore looks at both:
Product endotoxin
and
PPC recovery
9. Standard-Curve Performance Should Also Be Trended
In kinetic chromogenic testing, the standard curve is fundamental to quantitative analysis.
However, laboratories often treat it as a simple pass/fail requirement.
Long-term data can provide additional information.
For example, a laboratory could monitor:
- Standard-curve correlation
- Slope
- Intercept
- Reaction time
- Standard response
- Replicate variability
A gradual change could indicate:
- Reagent deterioration
- Instrument drift
- Temperature instability
- Pipetting variability
- Incorrect reagent preparation
- Water-quality problems
FireGene's Kinetic Chromogenic Endotoxin Test Kit uses kinetic absorbance detection at 405 nm and a quantitative standard-curve approach. The current product information lists a stated detection range of 0.005–10 EU/mL.
For laboratories using kinetic chromogenic methods, historical assay-performance data can therefore become a valuable QC dataset.
10. Reagent Lot-to-Lot Trends Matter
Endotoxin testing depends heavily on reagent performance.
A laboratory may observe apparently normal results for months and then see a sudden shift after changing reagent lots.
This does not automatically mean that the new lot is defective.
Other factors may have changed simultaneously.
Nevertheless, reagent-lot trending can help laboratories investigate whether the observed change correlates with:
- New reagent lot
- New CSE lot
- New water lot
- New microplate lot
- New consumables
- Instrument maintenance
This is particularly useful when troubleshooting unexplained shifts.
11. Analyst-to-Analyst Variability Can Be Hidden in the Data
Suppose three analysts perform the same endotoxin assay.
Analyst A
0.11–0.15 EU/mL
Analyst B
0.12–0.16 EU/mL
Analyst C
0.18–0.25 EU/mL
If all results pass, the laboratory may not immediately notice a problem.
But the data suggest that Analyst C may be producing systematically higher results.
Potential causes could include:
- Pipetting technique
- Timing
- Mixing
- Sample preparation
- Plate handling
- Reagent preparation
Trend analysis can therefore help identify operator-related analytical variation.
12. Instrument Trends Are Equally Important
For kinetic chromogenic testing, instrument performance can influence results.
Potential variables include:
- Optical performance
- Wavelength accuracy
- Temperature
- Reading interval
- Plate positioning
- Software calculation
- Incubation stability
If results begin shifting after instrument maintenance or calibration, historical data can help identify the relationship.
A laboratory should therefore consider connecting endotoxin results with:
Instrument ID
Calibration date
Maintenance date
Software version
where appropriate.
This turns an endotoxin database into a much more useful analytical resource.
13. Trend Analysis Can Help Detect Water Contamination Before Product Failure
Consider the following scenario.
A pharmaceutical plant produces an injectable product.
Finished-product endotoxin results have historically remained low.
Suddenly, water-system endotoxin begins increasing.
The product remains within specification.
A traditional release-only approach might conclude:
“No problem—the product passes.”
A trend-based approach asks:
“Why is the water result changing?”
That question may trigger:
- Additional sampling
- Water-system inspection
- Sanitization review
- Microbial investigation
- Biofilm assessment
- Equipment inspection
The manufacturer may be able to correct the problem before it reaches the final product.
This is one of the strongest arguments for endotoxin trend analysis.
14. Endotoxin Trending and OOS Investigation
When an OOS result occurs, historical data becomes extremely valuable.
Suppose the latest result is:
6.2 EU/mL
with a specification of:
≤5 EU/mL
The laboratory needs to determine whether this represents:
- A true product contamination event
- Analytical variability
- Sample preparation error
- Matrix interference
- Reagent issue
- Instrument problem
- Manufacturing-process change
Historical trend data can help answer:
Is this result consistent with a recent process shift, or is it an isolated event?
For example:
Previous 20 batches: 0.8–1.5 EU/mL
Current batch: 6.2 EU/mL
This looks very different from:
Previous 5 batches: 1.8 → 2.4 → 3.1 → 3.9 → 4.5 EU/mL
followed by:
Current batch: 6.2 EU/mL
The first pattern suggests a sudden event.
The second suggests a gradual process deterioration.
Those scenarios may require very different investigations.
15. Why OOT Investigation Can Be More Valuable Than Waiting for OOS
Waiting for an OOS result means waiting until the process has already crossed a predefined boundary.
OOT analysis provides an opportunity to intervene earlier.
Imagine:
Normal process
0.10–0.20 EU/mL
↓
Early shift
0.22–0.28 EU/mL
↓
Persistent trend
0.30–0.45 EU/mL
↓
OOS
0.50 EU/mL
If the laboratory waits until OOS, it may lose valuable time.
If the laboratory investigates the persistent trend, it may identify the root cause before the specification is exceeded.
This is the difference between:
Reactive QC
and
Preventive QC
16. Statistical Methods for Endotoxin Trend Analysis
Trend analysis does not always require sophisticated artificial intelligence.
Simple statistical tools can already provide substantial value.
Common approaches include:
Moving Average
A moving average can smooth short-term variability and reveal longer-term direction.
Standard Deviation
Historical standard deviation can help define expected process variability.
Control Charts
Control charts can help identify:
- Shifts
- Trends
- Outliers
- Increasing variability
Percentiles
Historical percentile analysis can help establish practical warning zones.
Regression
A regression model can help evaluate whether endotoxin concentration is systematically increasing or decreasing over time.
The key is not to create complicated statistics for their own sake.
The objective is:
Detect meaningful changes early enough to support a quality decision.
17. Establishing Warning and Action Levels
A useful trending program may include different levels of response.
Normal Zone
Results remain consistent with historical behavior.
Action: Continue routine monitoring.
Warning Zone
Results begin moving outside expected historical behavior.
Action: Increase attention and evaluate potential causes.
Action Zone
Persistent or statistically significant deviation is observed.
Action: Initiate formal investigation or preventive action according to the quality system.
OOS
The established specification is exceeded.
Action: Follow the applicable OOS investigation procedure.
This structure allows the laboratory to respond proportionally.
18. Why Historical Data Must Be Clean
Trend analysis is only as reliable as the data behind it.
Important metadata may include:
- Product
- Batch
- Sample location
- Sample type
- Analyst
- Instrument
- Reagent lot
- CSE lot
- Water lot
- Date
- Dilution
- PPC recovery
- Standard-curve parameters
- Final result
Without this information, a laboratory may see:
0.12 → 0.17 → 0.23 → 0.31
but have no idea why the values changed.
Good data structure turns a collection of test results into an analytical tool.
19. Don't Trend Results Without Context
A common mistake is to create a graph of endotoxin concentrations without recording the conditions under which those results were generated.
Suppose endotoxin increases after:
January 2026
What happened in January?
Maybe:
- A new raw-material supplier was introduced.
- A water-system sanitization procedure changed.
- A new analyst joined the laboratory.
- A new endotoxin reagent lot was introduced.
- A new instrument was installed.
- A manufacturing process changed.
Without contextual information, the graph shows a trend but cannot explain it.
Therefore:
Trend analysis should connect analytical data with manufacturing and laboratory metadata.
20. Sample Preparation Trends Should Not Be Ignored
Endotoxin results can also shift because of changes in sample preparation.
Important variables include:
- Dilution factor
- Sample concentration
- Mixing time
- Sample temperature
- Hold time
- Container
- Water source
- Transfer steps
This is particularly important for complex biologics.
A laboratory may believe that the product endotoxin level has changed when the real change is in the analytical procedure.
FireGene's Endotoxin Testing Sample Preparation Guide covers dilution, interference, recovery, sample handling, and other variables that can affect endotoxin results.
21. Trend Analysis Can Help Separate Product Problems From Analytical Problems
Consider two datasets.
Dataset A
Finished product endotoxin increases.
PPC recovery remains stable.
Standard curve remains stable.
Water endotoxin remains stable.
Raw-material endotoxin remains stable.
This pattern could suggest a product or manufacturing-process change.
Dataset B
Finished product endotoxin increases.
PPC recovery decreases.
Standard-curve performance changes.
Other products tested in the same assay also show higher results.
This pattern could suggest an analytical-system issue.
The same final result can therefore have very different meanings depending on the surrounding data.
This is why comprehensive trend analysis is so powerful.
22. Kinetic Chromogenic Testing Can Generate Richer Trending Data
One advantage of quantitative endotoxin testing is the amount of numerical data available.
Instead of simply recording:
Pass
or
Fail
a quantitative workflow can generate:
- EU/mL
- Standard-curve parameters
- Reaction time
- Replicate results
- PPC recovery
- Dilution behavior
This makes quantitative methods particularly attractive for laboratories interested in data trending.
FireGene's Kinetic Chromogenic Endotoxin Test Kit is a 96-well quantitative format with 405 nm kinetic absorbance detection.
However, laboratories should distinguish between analytical capability and regulatory suitability. FireGene currently labels this product Research Use Only and states that it is not licensed by FDA for end-product release of FDA-regulated pharmaceutical drugs, devices, or biologics.
For regulated release testing, the selected method must be appropriately qualified, validated, and accepted for the intended use.
23. Endotoxin Trend Analysis in the Era of USP <86>
The endotoxin-testing landscape is also changing technologically.
USP <86> provides additional bacterial endotoxin testing techniques using recombinant reagents such as recombinant Factor C and recombinant cascade reagents. USP explains that users remain responsible for verifying the suitability of the selected method for the specific material, drug substance, or drug product.
FDA's March 2026 revised guidance similarly broadened its language to accommodate recombinant reagents and emphasizes that sponsors should verify that the method is suitable for its intended purpose.
This creates an interesting implication for trend analysis.
When laboratories transition between technologies, they should carefully consider:
- Method comparability
- Historical baseline
- Detection characteristics
- Matrix response
- Standardization
- Trending continuity
A sudden change in endotoxin results after a method change does not automatically mean that the manufacturing process changed.
It may reflect the analytical method itself.
24. What Happens When a Laboratory Changes From LAL/TAL to Recombinant Testing?
Suppose a laboratory has five years of historical endotoxin data using a TAL/LAL Reagent-based method.
In 2026, the laboratory introduces a recombinant endotoxin method.
The new results appear consistently lower.
Should the laboratory conclude that manufacturing has improved?
Not necessarily.
Before interpreting the trend, the laboratory should consider whether the two methods produce comparable results for the specific product matrix.
This is where method verification and bridging studies can become important.
USP <86> specifically emphasizes verifying product suitability for the intended purpose, while FDA's 2026 guidance recognizes the broader use of recombinant reagents.
Therefore:
A method change can create a statistical discontinuity in historical endotoxin data.
The trend database should record that transition.
25. How to Build an Endotoxin Trending Program
A practical implementation can follow six stages.
Step 1 — Define What You Want to Detect
Examples:
- Increasing product endotoxin
- Water-system deterioration
- Raw-material variability
- Analytical drift
- Reagent-lot effects
Step 2 — Define the Data Fields
At minimum:
- Result
- Product
- Batch
- Date
- Sample location
- Method
Ideally also include:
- Analyst
- Instrument
- Reagent lot
- CSE lot
- PPC
- Dilution
Step 3 — Establish the Historical Baseline
Use representative historical data.
Avoid establishing a baseline from abnormal batches.
Step 4 — Define Warning Criteria
Possible criteria include:
- Statistical control limits
- Consecutive increases
- Repeated high results
- Increased variability
- PPC shifts
Step 5 — Review Trends Periodically
Trend analysis should become part of routine quality review rather than an activity performed only after OOS.
Step 6 — Connect Trends With CAPA
When a meaningful trend is detected, the organization should determine whether:
- Additional sampling
- Root-cause investigation
- Preventive maintenance
- Supplier review
- Water-system intervention
- Method review
is appropriate.
26. A Practical Endotoxin Trend Review Workflow
A pharmaceutical QC laboratory could structure its review like this:
Collect endotoxin results
↓
Verify data quality
↓
Group by product / material / location
↓
Plot historical trend
↓
Compare against baseline
↓
Evaluate variability
↓
Review PPC and analytical controls
↓
Check water / raw materials / equipment data
↓
Identify potential shift
↓
Determine OOT status
↓
Investigate if necessary
↓
Implement preventive action
↓
Continue monitoring
This transforms endotoxin testing from a passive release test into an active contamination-control tool.
27. Ten Questions Every QC Laboratory Should Ask About Its Endotoxin Data
1. Are endotoxin results trending upward?
2. Are results becoming more variable?
3. Are particular products showing higher endotoxin levels?
4. Is one raw-material supplier consistently higher?
5. Are specific water-system sampling points changing?
6. Are PPC recoveries becoming less stable?
7. Did the trend change after a reagent-lot transition?
8. Did results change after instrument maintenance?
9. Did the sample preparation procedure change?
10. Did the endotoxin method itself change?
These questions can often reveal problems that a simple pass/fail review would miss.
28. Common Mistakes in Endotoxin Data Trending
Mistake 1: Looking Only at OOS Results
OOS is often the end of the problem—not the beginning.
Mistake 2: Ignoring OOT Behavior
A compliant result can still be unusual.
Mistake 3: Trending Without Metadata
A graph without context is difficult to interpret.
Mistake 4: Ignoring PPC Data
PPC shifts can reveal analytical problems.
Mistake 5: Ignoring Water-System Trends
Water can be an upstream source of endotoxin.
Mistake 6: Mixing Different Test Methods
Method changes can create artificial shifts.
Mistake 7: Ignoring Reagent-Lot Changes
Lot transitions can coincide with changes in analytical response.
Mistake 8: Ignoring Sample Dilution
Different dilution strategies can make historical results difficult to compare.
Mistake 9: Treating Every Outlier as Contamination
An outlier may result from analytical variability.
Mistake 10: Collecting Data Without Using It
A laboratory can have thousands of endotoxin results and still miss a developing problem if the data are never analyzed.
29. How FireGene Endotoxin Testing Products Fit Into a Data-Driven QC Strategy
A data-driven endotoxin program depends on more than the test reagent.
It requires consistent performance across:
- Reagent
- Standards
- Water
- Sample preparation
- Instrument
- Controls
- Data analysis
FireGene offers several components that can support different parts of an endotoxin-testing workflow.
Kinetic Chromogenic Endotoxin Test Kit
The FireGene Kinetic Chromogenic Endotoxin Test Kit uses a quantitative 96-well format with 405 nm kinetic detection. The product page lists a stated detection range of 0.005–10 EU/mL.
This type of quantitative workflow can provide numerical data useful for research and method-development trend analysis.
Again, the current FireGene labeling states that this kit is Research Use Only and is not licensed by FDA for end-product release of FDA-regulated pharmaceutical drugs, devices, or biologics.
Control Standard Endotoxin
The FireGene Control Standard Endotoxin is a freeze-dried E. coli O111:B4 endotoxin preparation calibrated against a national standard and intended for applications including sensitivity checks, interference testing, and positive-control studies.
Endotoxin Assay Water
The FireGene Endotoxin Assay Water is intended for negative controls, CSE/ECV reconstitution, sample dilution, and other endotoxin-testing workflows. The current product specification is less than 0.005 EU/mL.
Together, these components can help laboratories build a more standardized analytical workflow—an important prerequisite for meaningful long-term data trending.
30. The Future of Endotoxin QC Is More Than Pass or Fail
The pharmaceutical industry is moving toward increasingly sophisticated quality systems.
The same trend is visible in endotoxin testing.
Traditional approach:
Sample → Test → Pass/Fail
Modern approach:
Sample → Test → Quantify → Trend → Compare → Investigate → Prevent
This shift is particularly important as pharmaceutical products become more complex.
Modern formulations can include:
- Monoclonal antibodies
- Peptides
- Lipid-based systems
- Cell and gene therapy products
- Complex biologics
- Combination products
- Advanced injectable formulations
These products can introduce more analytical and manufacturing variables.
USP <1085> was developed specifically to provide additional practical guidance for modern endotoxin testing, including complex parenteral formulations, preparatory requirements, labware qualification, PPC criteria, interference, routine testing, and OOS investigations.
31. Frequently Asked Questions
What is endotoxin testing trend analysis?
It is the systematic review of endotoxin test results over time to identify shifts, trends, variability, or unusual behavior before they become significant quality problems.
Is trend analysis the same as OOS investigation?
No. OOS investigation is triggered when a result exceeds an established specification. Trend analysis can identify unusual behavior while results are still within specification.
What is an OOT endotoxin result?
OOT generally refers to a result that remains within specification but falls outside expected historical or statistical behavior.
Should PPC recovery be trended?
Yes. PPC recovery can provide valuable information about changes in matrix interference and analytical performance.
Should endotoxin water results be trended?
Yes. Water-system endotoxin data can provide an important early warning of potential contamination or system deterioration.
Can kinetic chromogenic testing help with trend analysis?
Quantitative kinetic methods can generate numerical data that are convenient for statistical analysis and historical trending. The selected method still needs to be appropriate and validated for its intended use.
What if the laboratory changes from LAL/TAL to recombinant reagents?
Historical data should be interpreted carefully because a method change may create a discontinuity. Product-specific method suitability and, where appropriate, comparability work should be considered. FDA and USP both emphasize suitability of recombinant methods for their intended purpose.
How often should endotoxin trends be reviewed?
The appropriate frequency depends on the product, manufacturing process, risk level, historical variability, and quality system. High-risk systems may warrant more frequent review.
Can trend analysis replace routine endotoxin testing?
No. Trend analysis supplements routine testing; it does not replace the underlying validated endotoxin-testing procedure.
Can trend analysis prevent OOS results?
It cannot guarantee prevention, but it can help identify early signals that may justify investigation and preventive action before an OOS event occurs.
Conclusion
Endotoxin testing has traditionally been treated as a simple quality gate:
Pass = release
Fail = investigate
But this approach leaves valuable information unused.
Every endotoxin result contains information about:
- The product
- The manufacturing process
- Raw materials
- Water systems
- Equipment
- Analytical performance
- Reagent behavior
- Sample preparation
When those results are evaluated over time, they can reveal patterns that individual tests cannot.
A gradual increase in endotoxin concentration.
A shift in PPC recovery.
A change in water-system results.
Increasing variability between batches.
A sudden change after a reagent-lot transition.
A difference between analysts.
None of these events necessarily means that a product has failed.
But each may be a signal worth understanding.
This is why the future of endotoxin testing is increasingly moving from:
“Does the batch pass?”
to:
“What is the endotoxin data telling us about the process?”
The regulatory environment is moving in the same direction. FDA's March 2026 guidance provides updated recommendations for endotoxin and pyrogen testing, while USP <1085> expands practical guidance around routine testing, PPCs, interference, laboratory materials, and OOS investigations.
For QC laboratories, the most effective strategy is therefore to combine:
- Reliable Endotoxin Testing
- Consistent Sample Preparation
- Strong Analytical Controls
- Historical Data
- Trend Analysis
- Risk-Based Investigation
- Preventive Action
The ultimate goal is not simply to generate another passing endotoxin result.
It is to build a system capable of recognizing small changes before they become major quality problems.
The best endotoxin testing program doesn't just tell you when something has failed. It helps you recognize when something is starting to change.
That is the real value of endotoxin data trending.
Recommended FireGene Resources
For laboratories developing or optimizing an endotoxin testing and trending strategy:
- FireGene Kinetic Chromogenic Endotoxin Test Kit
- FireGene Control Standard Endotoxin (CSE)
- FireGene Endotoxin Assay Water
- Endotoxin Testing Sample Preparation Guide
- How to Validate an Endotoxin Test Method
- Endotoxin Testing for Raw Materials and Excipients
- The Ultimate Guide to Kinetic Chromogenic Endotoxin Assays
FireGene Endotoxin Testing
Ready to run your endotoxin assay?
FireGene offers a complete endotoxin testing toolkit — from TAL reagents and CSE standards to pyrogen-free consumables and LAL reagent water. All products are aligned with USP <85>, EP 2.6.14, and JP 4.01.


