
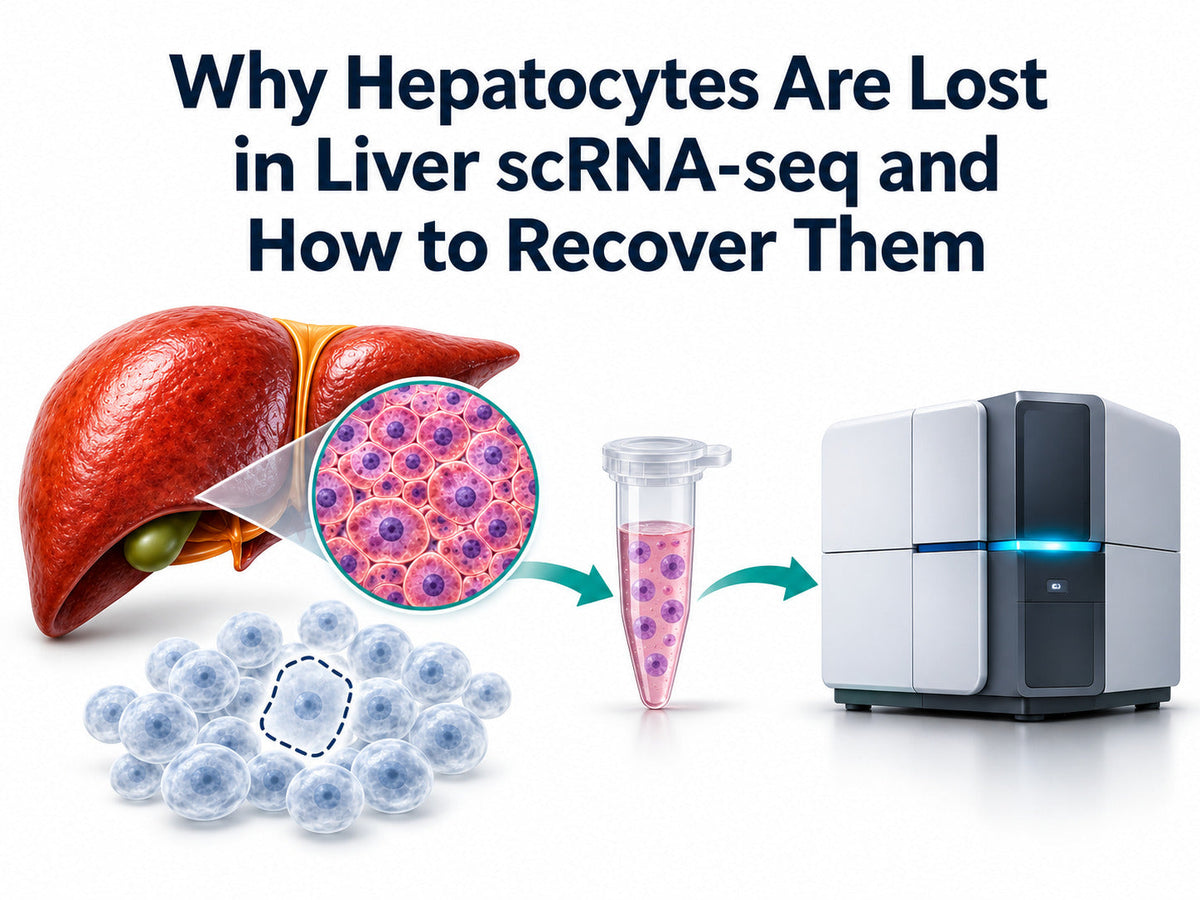
Quick answer. To improve hepatocyte recovery in liver scRNA-seq, estimate viable hepatocyte counts after dissociation, after cleanup, and before loading. Then compare hepatocyte representation before and after computational QC. This helps identify whether recovery drops during sample preparation, capture, or filtering. Consider a matched snRNA-seq pilot if intact-cell recovery remains low.
FireGene Liver Sample Preparation Kit Catalog
|
Product |
Catalog number |
When to use it |
Listed pack formats |
Order |
|
Liver Dissociation Kit |
FG-BA3323 |
Prepare an intact-cell suspension from fresh liver tissue |
10 or 50 reactions |
|
|
Dead Cell Debris & Impurities Removal Kit |
FG-BA3339 |
Evaluate cleanup when dead cells or debris interfere with suspension quality |
Product page shows a 2-reaction option and documents 10- and 50-reaction formats |
For Research Use Only. Choose FG-BA3323 when your starting material is liver tissue. Consider FG-BA3339 when you already have a cell suspension and want to evaluate a cleanup step.
Why Choose FireGene for Hepatocyte Sample Preparation?
The two kits address different points in the workflow. The 10-reaction Liver Dissociation Kit suits a pilot that compares recovery across specimens. The 50-reaction pack suits a larger study once you have planned your sample count and repeat preparations. The certificate for lot FG250821 records a pass against two release criteria: at least 85% viable hepatocytes after digestion and at least 1 million viable cells per 100 mg of mouse liver. Use those figures as a lot of acceptance thresholds and measure recovery in your own specimens. Liver Dissociation Kit and lot documentation
Five Reasons Hepatocytes Go Missing in Liver scRNA-seq
Hepatocyte loss in liver scRNA-seq can begin during tissue processing. Hepatocyte underrepresentation in liver scRNA-seq can also become apparent after capture or filtering. A sequencing dataset with few hepatocytes gives you a starting point. Counts from earlier stages help you locate the decline.
|
Reason |
What you may observe |
What to check next |
|
1. Incomplete release or cell death during dissociation |
Few viable hepatocytes appear immediately after tissue processing. |
Check residual tissue, viable recovery, and signs of hepatocyte cell death during isolation. |
|
2. Loss during fractionation or cleanup |
The viable hepatocyte count drops after a wash, separation, or debris removal step. |
Compare absolute counts before and after the step. Check which fraction you retained. |
|
3. FACS-associated hepatocyte loss |
The sorted sample contains fewer viable hepatocytes than expected from the input. |
Compare counts and viability entering and leaving fluorescence-activated cell sorting (FACS). |
|
4. Hepatocyte capture bias |
Large hepatocytes are visible before loading, but the initial sequencing data contains few plausible hepatocyte profiles. |
Review the loading estimate, platform compatibility, and initial barcode calls. |
|
5. Post-sequencing QC filtering |
Plausible hepatocyte profiles are present before filtering and decline sharply afterward. |
Check which profiles were excluded by mitochondrial percentage, detected-gene, or total-count filters. |

Wet-Lab Fixes for Low Hepatocyte Recovery
Start with a hepatocyte isolation workflow suited to your species, tissue condition, and endpoint. When preparing hepatocytes for single-cell RNA sequencing, record tissue input, total viable cell count, and the estimated hepatocyte fraction. Repeat the measurements at the stage you want to evaluate. This helps distinguish a drop in overall yield from a disproportionate loss of hepatocytes.
Check Recovery Immediately After Dissociation
Assess residual tissue alongside the number of intact, viable hepatocytes in your liver single-cell suspension. If counts are already low, review tissue condition and handling before adding cleanup. Include representative disease and control specimens in the same pilot. A method that works well with control tissue may show a different pattern with fragile hepatocytes from diseased tissue.
Compare Centrifugation and FACS for Your Endpoint
A published method for mouse hepatocyte isolation for scRNA-seq uses centrifugation to prepare viable hepatocytes and non-parenchymal cells. This centrifugation-based hepatocyte isolation workflow offers a route to hepatocyte isolation without FACS when a hepatocyte-rich preparation meets your needs. If you need a marker-defined population, assess how much sorting improves purity and how many viable cells you retain. Keep the hepatocyte-rich fraction and the non-parenchymal fraction linked to the same specimen ID when studying both compartments. This matters when comparing parenchymal and non-parenchymal liver cells. Where tissue permits, retain a mixed aliquot for context and record which samples were enriched before sequencing.
Measure Viable Hepatocyte Recovery Before and After Cleanup
When evaluating a dead cell and debris removal kit, compare matched aliquots and record both hepatocyte percentage and absolute viable hepatocyte count. For example, 100,000 viable cells with 20% hepatocytes contain an estimated 20,000 viable hepatocytes. After cleanup, 40,000 viable cells with 30% hepatocytes contain about 12,000. In this illustrative example, the hepatocyte proportion rises while the number available for loading falls.

Liver Single-Cell Sample Prep QC Before Loading
For liver single-cell sample prep QC, use your sequencing core’s acceptance criteria for the assay. Record hepatocyte viability, viable cell yield, and cell concentration before loading. Inspect for cell aggregates in scRNA-seq samples and cell debris in liver single-cell suspensions. Include the estimated target-cell count alongside the overall viability percentage.
When comparing hepatocyte recovery before and after capture, document what each estimate represents. A loading aliquot estimates the fraction of hepatocytes entering the instrument. Sequencing counts reflect barcodes that were captured, called, retained, and annotated. Compare proportions at each checkpoint to see where liver cell-type representation changes. A discrepancy can flag cell size bias in scRNA-seq or identify a filtering or annotation decision worth reviewing.
Analysis Fixes for Mitochondrial QC Thresholds
Review mitochondrial RNA percentage, detected genes, and total UMI counts together. A high mitochondrial fraction paired with very few detected genes can indicate a compromised profile. Mitochondrial percentage can vary across samples and cell populations, so check how a shared cutoff affects candidate hepatocytes before applying it across the study.
- Review the distributions by sample. Plot mitochondrial percentage against detected genes and inspect total UMI counts. Look for groups of barcodes with unusually low complexity and for shifts across specimens.
- Identify plausible hepatocytes before the final cutoff. Use a coherent expression profile, with markers such as ALB and HNF4A where appropriate. Check whether the broader profile supports the annotation, especially in libraries with abundant liver RNA in the background.
- Compare candidate thresholds. Hold other filters constant and record the hepatocyte count and proportion retained under each candidate cutoff. Inspect profiles recovered by a less restrictive cutoff for gene complexity, coherent identity, and possible doublets.
- Check whether the conclusion changes. Repeat the main comparison under reasonable alternative cutoffs. Report whether your findings depend on one filtering choice and document how you applied the final criteria across samples.
- A sharp fall in plausible hepatocyte profiles after QC points to computational filtering as a contributor. If few plausible profiles are present before the final filters, review loading, capture, and cell calling. This separates a filter-sensitive result from an earlier recovery problem.

How Should You Assess Steatotic Hepatocyte Recovery?
In MASLD liver sample preparation, include steatotic tissue in your pilot. Lipid-laden hepatocytes can be large and fragile during dissociation and capture. Compare viable hepatocyte recovery after preparation with the proportion identified after sequencing. Review steatotic hepatocyte recovery by specimen so a strong result in controls does not obscure a drop in the disease group.
Record handling time and temperature across groups. Liver tissue dissociation bias can change which cells you recover, and processing can also affect gene expression. If your endpoint involves stress or activation, compare the same annotated cell type across specimens and use the handling records to help interpret differences.
Liver scRNA-seq vs. snRNA-seq: When Should You Switch?
Consider single-nucleus RNA sequencing of the liver when your specimen is snap-frozen or when a matched pilot shows better representation of the hepatocyte states your experiment needs. Fresh liver scRNA-seq remains a useful choice when you recover enough viable intact cells. Human liver studies have found differences in cell-type frequencies and transcript profiles between cells and nuclei.
|
Study situation |
Approach to evaluate |
What to check |
|
Fresh liver yields enough viable hepatocytes |
scRNA-seq |
Viable hepatocyte count before loading and retention after analysis QC |
|
The available material is snap-frozen liver |
Frozen liver snRNA-seq |
Nuclei integrity, concentration, and hepatocyte representation in snRNA-seq |
|
Hepatocytes remain scarce after wet-lab and analysis checks |
Matched cells and nuclei pilot |
Which hepatocyte states each approach captures and whether the result supports your study |
For hepatocyte nuclei isolation, choose a nuclei extraction kit for liver samples that fits your specimen and platform. Check nuclei integrity and debris before loading. Compare target-cell representation after pilot sequencing and use a consistent modality across groups where your study design permits.

Frequently Asked Questions
Why are hepatocytes underrepresented when overall viability is high?
Overall viability describes the whole suspension. A sample may contain many viable immune or stromal cells while yielding few viable hepatocytes. Estimate the viable hepatocyte count separately and compare it with the proportion present in the initial sequencing data and after QC.
Can you isolate hepatocytes for scRNA-seq without FACS?
Yes. A published mouse protocol uses centrifugation to prepare hepatocytes and non-parenchymal cells for scRNA-seq. Consider this approach when your experiment can use a hepatocyte-rich fraction. If your study needs a marker-defined subset, track the yield and identity of that subset through sorting.
Should you use the same mitochondrial cutoff for every liver sample?
Compare mitochondrial percentage, detected genes, and total UMI counts across samples first. Test how candidate cutoffs affect hepatocyte retention, then document the rule you use for the main analysis. This gives reviewers a way to assess whether filtering influenced the observed cell proportions.
Does dead cell removal improve hepatocyte yield?
Cleanup can improve suspension quality while reducing the absolute number of viable hepatocytes. Compare matched aliquots and judge the result using the number of viable target cells, overall sample quality, and your loading requirements.
Which mouse liver dissociation kit should you order for a pilot?
Choose FG-BA3323 for fresh liver tissue and size the pack around your specimen count and planned repeats. Include FG-BA3339 if you want to test cleanup in parallel. Share the species, tissue format, target cells, and sequencing assay when requesting a quote. Request a quote
References
- Protocol to obtain high-quality single-cell RNA-sequencing data from mouse liver cells using centrifugation. STAR Protocols, 2022. PMID 36386875.
- Andrews et al. Single-Cell, Single-Nucleus, and Spatial RNA Sequencing of the Human Liver Identifies Cholangiocyte and Mesenchymal Heterogeneity. Hepatology Communications, 2022. PMID 34792289.
- Protocol for minimized-bias profiling of liver and visceral adipose tissue in mice using integrated single-nucleus RNA sequencing. STAR Protocols. PMCID PMC13356638.
- Cell Preparation for Single Cell Protocols. 10x Genomics handbook, CG00053.
- O’Flanagan et al. Dissociation of solid tumor tissues with cold active protease for single-cell RNA-seq minimizes conserved collagenase-associated stress responses. Genome Biology, 2019. DOI 10.1186/s13059-019-1830-0.
- Hippen et al. miQC: An adaptive probabilistic framework for quality control of single-cell RNA-sequencing data. PLOS Computational Biology, 2021. PMCID PMC8415599.
Order Reagents for Your Hepatocyte Recovery Pilot
Start with FG-BA3323 for liver tissue dissociation. Include FG-BA3339 if you plan to compare suspensions before and after debris removal. Send FireGene your specimen type, sample count, and sequencing endpoint to select the pack sizes for your pilot.
Shop Liver Dissociation Kit · Shop Dead Cell Debris Removal Kit · Browse Sample Preparation Kits · Request a Quote


